
Managerial accountants keep track of their company’s financial health throughout the year.
Financial statements tell the story of financial health through various metrics, such as cash flow, liquidity, and profit and loss.
Several financial statement analysis tools exist – one of the more popular methods is the accounting ratio.
In this article, I’ll discuss the different types of accounting ratios, why they’re essential for understanding financial health, and how to calculate each.
What Are Accounting Ratios?
Accounting ratios are a crucial tool for analyzing financial statements – they compare the connection between two figures in your financials.
The ratios track overall financial performance and allow management, investors, and key stakeholders to make data-backed decisions.
How Do Accounting Ratios Help You
These ratios are helpful for all stakeholders who seek to understand a company’s profitability and health. Accounting ratios tell you many different pieces of financial information about your company, such as whether it has accumulated too much debt or has too much inventory.
Exam Secrets Cheat Sheet
 No worries, your information is safe with me. I hate spam too!
How to Calculate Different Types of Accounting Ratios
Let’s discuss each different type of accounting ratio in more depth.
Liquidity Ratios
First, I want to explain liquidity, which refers to how much cash a company has readily available or how quickly assets can be converted to cash.
Liquidity ratios are a set of financial metrics used to determine a company’s ability to pay its current debts.
Put another way, liquidity ratios measure a company’s ability to convert assets into cash without borrowing.
A higher liquidity ratio represents more liquidity, meaning a company can better cover its debts.
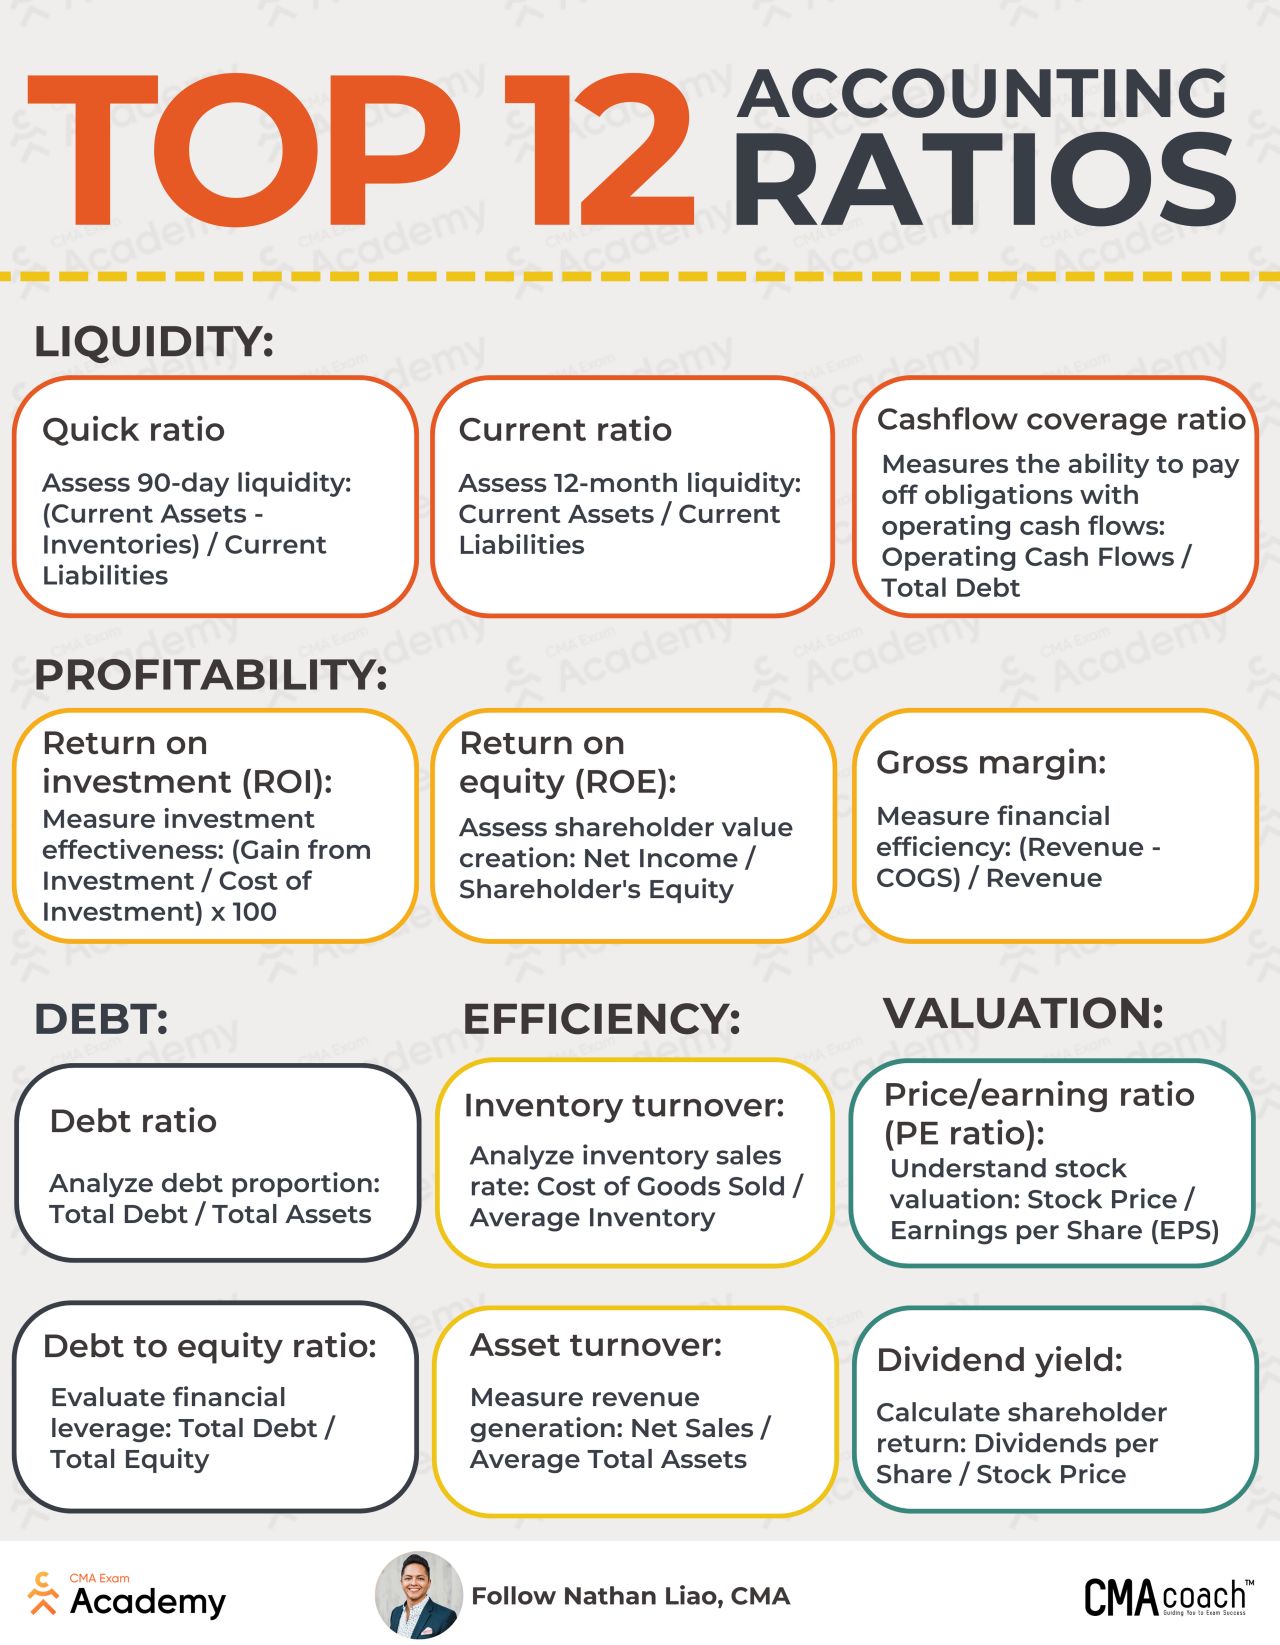
Three common liquidity ratios are the quick ratio, current ratio, and cash flow coverage ratio.
Quick Ratio
The quick ratio, in short, helps you track your 90-day liquidity.
It indicates a company’s ability to pay its current liabilities without needing to sell inventory or borrow cash. In other words, it measures short-term liquidity and the ability to meet short-term debt obligations.
The quick ratio is sometimes called the acid test ratio. An acid test is a term for a quick test to produce instant results.
The quick ratio formula is a company’s quick assets divided by its current liabilities.
Quick ratio = (current assets – inventories) / current liabilities
What are quick assets and current liabilities?
Quick assets are current assets that can be converted into cash within 90 days. Current liabilities are all debt obligations due within 12 months.
A quick ratio of 1 or above is considered good and indicates a company has enough quick assets to cover liabilities.
Current Ratio
The current ratio is a company’s ability to pay off current liabilities (those due within 12 months) with its total current assets (cash and cash equivalents) and inventories.
Where the quick ratio measures 90-day liquidity, the current ratio assesses 12-month liquidity.
The current ratio formula is a company’s current assets divided by its current liabilities.
Current ratio = current assets / current liabilities
A ratio of 1.5 to 3 is considered a good current ratio, though this figure alone doesn’t tell the entire story.
Cash Flow Coverage Ratio
The cash flow coverage ratio measures a company’s ability to pay obligations with operating cash flows.
The ratio indicates the money available for a company to meet its current financial responsibilities.
The larger the cash flow coverage ratio, the more financial freedom a company has.
The cash flow coverage ratio is the sum of operation cash flows divided by the company’s total debt.
Cash flow coverage = operating cash flows / total debt
Profitability Ratios
Profitability ratios are indicators used to evaluate the ability to create earnings over time when considering revenue, operational costs, assets, and shareholders’ equity.
These ratios are calculated using finances from a specific period.
A higher ratio outcome is generally a more positive indicator of profitability.
Three common profitability ratios are:
- Return on investment
- Return on equity
- Gross margin
Return on Investment
Return on investment (ROI) is a profitability ratio that measures investment effectiveness or the benefit an investor will receive in relation to their investment capital.
The higher the ratio, the greater the return.
Return on investment is calculated by dividing the gain from the investment by the cost of the investment and then multiplying by 100.
ROI = (gain from investment / cost of investment) x 100
Return on Equity
The return on equity (ROE) ratio assesses the value shareholders create. It’s a gauge of profitability and how efficiently a company generates profits.
The higher the return on equity ratio, the better the company converts its equity into profits.
The ROE ratio is calculated by dividing net income by the total shareholder’s equity.
ROE = net income / shareholder’s equity
Gross Margin
The gross margin ratio measures operational efficiency. Sometimes called the gross profit margin ratio, it compares the gross margin of a company to its revenue.
To phrase it differently, gross margin tells the story of a company’s profit after paying off its cost of goods sold (COGS).
The ratio indicates the percentage of each dollar of revenue a company retains as gross profit and is calculated by subtracting COGS from revenue and dividing by revenue.
Gross margin = (revenue – COGS) / revenue
Debt Ratios
Debt ratios, sometimes known as leverage ratios, are financial calculations that measure the extent of a company’s leverage – or the proportion of debt-financed assets.
I’ll discuss debt and debt to equity ratios, which help determine total debt.
Debt Ratio
To analyze the proportion of debt a company carries, you divide the total debt by total assets.
A debt ratio greater than 1 means a large number of a company’s assets are funded by debt. This could indicate a greater risk of loan default, especially if interest rates rise.
Debt Ratio = total debt / total assets
Debt to Equity Ratio
The debt to equity ratio measures a company’s leverage or capacity to repay its financial obligations.
To say it another way – the ratio indicates a company’s reliance on debt rather than equity to finance assets.
A high debt to equity ratio means the company has excessive debt and may be unable to repay those debts.
As the name indicates, the ratio is calculated by dividing total debt by equity.
Debt to equity ratio = total debt / total equity
Efficiency Ratios
Efficiency ratios measure a company’s ability to convert its production into cash. These ratios are often calculated over extended periods, possibly several years.
I’ll discuss inventory turnover and asset turnover.
Inventory Turnover
The inventory turnover ratio is the number of times a company has sold and replenished its inventory over a specific period.
This ratio can also calculate how long it will take to move the on-hand inventory.
A higher inventory turnover ratio indicates strong sales.
To analyze the inventory sales rate, divide COGS by the average inventory of the assessed period.
Inventory turnover ratio = Cost of goods sold / average inventory
Asset Turnover
The asset turnover ratio measures how efficiently a company uses its assets to generate sales.
A higher asset turnover ratio is better, showing the company produces more sales per asset owned and indicates an efficient use of those assets.
To measure revenue generation, divide net sales by the average total assets over a specific period.
Asset turnover ratio = net sales / average total assets
Valuation Ratios
Valuation ratios give insight into a company’s share price to evaluate its investment potential.
Price/Earning Ratio
The price/earning (PE) ratio provides context into the company’s stock valuation. The PE ratio measures a company’s share price with its earnings per share, indicating whether the stock is cheap or expensive relative to its earnings.
A higher PE ratio means a higher stock price.
To understand a company’s stock valuation, divide the stock price by the earnings per share.
Price/Earning Ratio = stock price / earnings per share
Dividend Yield
The dividend yield is a calculation of shareholder return. The ratio measures the value of a company’s dividends compared to the market share.
To calculate the dividend yield, measure the value of dividends received for each share owned against the stock price.
Dividend yield = dividends per share / stock price
Accounting Ratios for Managerial Accountants
Incorporating various accounting ratios into your financial statement analysis gives you a complete view of a company’s financial health.
I’ve created a quick reference guide on my LinkedIn profile for all the above accounting ratios. Save the post for the future, and follow me for more expert advice for current and future managerial accountants.
Are you considering fast-tracking your career with a professional certification? The CMA is an excellent option for accountants. I’m here to help you study and pass the CMA exam.

Hi, I’m Nathan Liao (aka the CMA Coach)! For the last 11 years, over 100,000 accounting and finance leaders came knocking at my door seeking guidance and help. If you’re also aiming to pass the CMA exam on your very first try—without wasting away time or money—you’ve found your ultimate guide. Dive in deeper to discover more about me and the dedicated team that powers CMA Exam Academy. Click here and let’s embark on this journey together!
